Clustering
This blog is based on Jong-han Kim’s Linear Algebra
Clustering objective
$G_j \subset {1, \dots, N}$ is group $j$, for $j = 1, \dots, k$
$c_i$ is group that $x_i$ is in: $i \in G_{c_I}$
group representatives: $n$-vectors $z_1, \dots, z_k$
clustering objective is
$J^{\text{clust}}$ small means good clustering
goal: choose clustering $c_i$ and representatives $z_j$ to minimize $J^{\text{clust}}$
Partitioning the vectors given the representatives
suppose representatives $z_1, \dots, z_k$ are given how do we assign the vectors to groups, i.e., choose $c_1, \dots, c_N$?
$c_i$ only appears in term $\lVert x_i - z_{c_i}\rVert^2 \ \text{in} \ J^{\text{clust}}$
to minimize over $c_i$, choose $c_i$ so $\lVert x_i - z_{c_i}\rVert^2 = \min_j{\lVert x_i - z_j\rVert^2}$
$k$-means algorithm
alternate between updating the partition, then the representatives
a famous algorithm called k-means
objective $J^{\text{clust}}$ decreases in each step
코드
import numpy as np
import matplotlib.pyplot as plt
np.random.seed(42)
data = np.concat([
np.random.randn(100, 2) + (10, 5),
np.random.randn(100, 2) + (5, 5),
np.random.randn(100, 2) + (-5, 5)
])
init_centre = data[0:3]
print(init_centre)
def kmeans(k):
for i in range(10):
dist = np.sum(np.sqrt((data[:] - init_centre[:, np.newaxis])**2), axis=2)
groups = np.argmin(dist, axis=0)
print(groups)
old_centroids = init_centre.copy()
for i in range(k):
if data[groups == i].shape[0] > 0:
init_centre[i] = data[groups == i].mean(axis=0)
if np.abs((init_centre - old_centroids).sum()) < 0.1:
break
plt.figure(figsize=(7, 5))
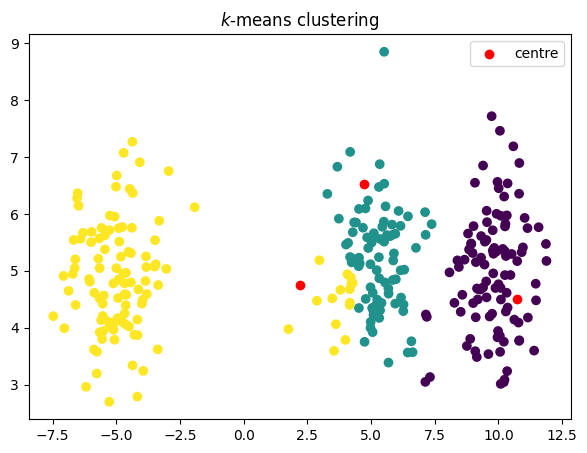
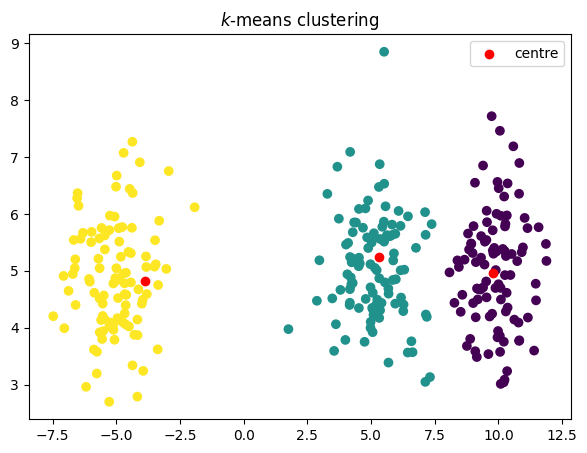
plt.title("$k$-means clustering")
plt.scatter(data[:, 0], data[:, 1], c=groups)
plt.scatter(old_centroids[:, 0], old_centroids[:, 1], c="red", label="centre")
plt.legend()
plt.show()
kmeans(3)